What the authors saw
The 23 July post described long-term resistance around −0.5 and a shorter-term rising trend. The authors saw the available space between trend lines narrowing, but explicitly said they did not know what would happen next.
The original spelling “godinex” remains in this page’s historical address so links to the old article continue to resolve. The index’s name in the current text is GodIndex.
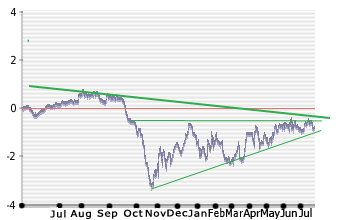
What later captures show
The homepage captured on 22 July displayed −0.88804. A September capture later displayed +0.864280. These are two archived displays at different dates. They do not identify the exact date of a breakout, its path or the reliability of the earlier pattern.
A test of a forecast needs a fixed rule, a time horizon and a way to count failures as well as successes. It also needs a sufficiently complete series and a stable definition of the underlying index. The archive does not supply all of these.
Why preserve a method we cannot validate?
The charts document how the original project borrowed the language of market indices to communicate social responses. That is interesting in its own right: the presentation may have shaped what readers thought the number represented.
The appropriate conclusion is historical, not predictive. This is what the authors plotted and discussed in July 2009. For a current reader, the capture collection provides a transparent way to inspect later displays without pretending that the old trend lines became a validated sentiment-forecasting model.
Sources & verification
Editorial review: 6 September 2026. Found an error or another archive? Please contact us.