May 2008: a question becomes an index
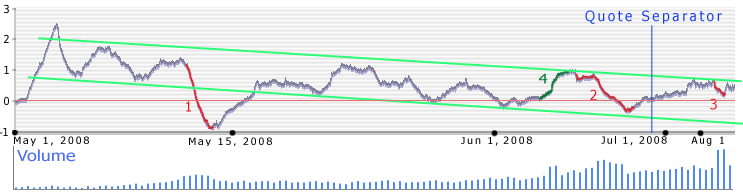
The original report places the start of its observation period on 1 May 2008. Its account is unusually revealing about the beginning: the rapid early rise was partly a consequence of adjusting the calculation as participation grew. A graph of those first days cannot be interpreted as a clean change in public sentiment.
This distinction matters throughout the archive. A numerical index is both a record of responses and a product of decisions about calculation. Without the original code and vote records, we cannot separate all of those effects retrospectively. The report itself is evidence about the project’s own explanation, not an independent audit of it.
The original experience
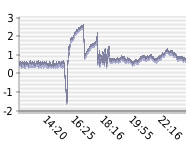
The site placed the question, rating controls and a GodIndex chart together. Country views and a running display gave a personal response a public context. The surviving screenshot below is a historical image, not an active voting interface.
That design could encourage return visits, but it also raises a research question: did seeing the existing score influence a person’s next rating? The archive cannot answer that. A future experiment could compare a score-visible interface with one in which the aggregate appears only after submission.
Summer 2008: interpreting events
The first report examined the China earthquake, the US presidential nomination contest, US floods and the Georgia war. Its authors attached explanatory stories to movements in the index. Those stories are part of the historical record, but temporal proximity does not establish causation.
A major event could change the views of existing participants, attract a different audience, or prompt a burst of repeated daily participation. A country-specific response could also outweigh changes elsewhere. Those are distinct mechanisms, and the surviving aggregate figures do not let us choose between them.
Autumn 2008: a sharply negative period
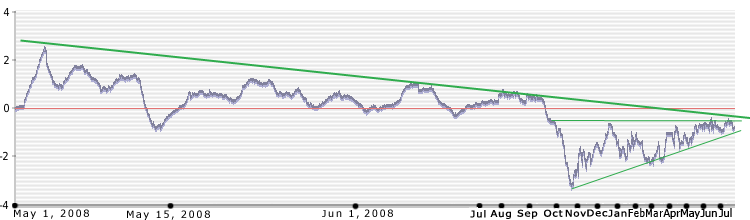
The September financial-crisis commentary described falling regional indices. The archived homepage captured on 21 September displayed −0.55306; the 25 October capture displayed −3.36287. The difference is −2.80981 index points between these two captured displays, not a one-day fall.
October’s display is the lowest in the recovered homepage collection. It is not established as the all-time minimum. The observation dates are unevenly spaced, and important highs or lows may have occurred when no capture was made. There is also no defensible way to calculate a daily volatility or a complete 2008 return from these points.
2009: recovery, publicity and an unresolved forecast
The March 2009 capture still showed a strongly negative value. By July the displayed index was closer to zero. A 23 July post described a narrowing space between trend lines and resistance near −0.5. The authors did not know which direction the index would take next.
A later September capture displayed a positive value. This documents a later positive display, but does not by itself validate the earlier technical analysis: the archive lacks a complete series, a fixed prediction horizon and an out-of-sample test. The July article revisited explains the difference.
Meanwhile, Polish publications covered the experiment from psychological, religious and media-critical perspectives. Our press bibliography records that attention without treating a mention as an endorsement.
The surviving 2010 displays are not a closing date
The captures dated 20 July and 21 August 2010 both display +0.370741 with a displayed change of +0.004869. An identical display does not prove that the index was recalculated on both dates. It could reflect unchanged data or a stale page.
The last two observations are the end of this recovered numerical collection, not a verified shutdown date. We have not recovered a continuous daily dataset, a final operational statement, or evidence establishing the last day on which voting worked. The new launch must therefore be treated as a separate series, rather than seamlessly joined onto 2010.
Recovered observations: inspect every source
The plot contains 22 captures and 17 distinct displayed close values. Points are not connected because the missing intervals are unknown. This is deliberately a record of evidence, not a smoothed reconstruction.
| Capture date (UTC) | Displayed close | Displayed change | Compared with preceding capture |
|---|---|---|---|
| 2008-06-17 | 0.49346 | +0.03790 | Changed display |
| 2008-06-19 | 0.54685 | +0.04418 | Changed display |
| 2008-06-25 | 0.56049 | +0.013635 | Changed display |
| 2008-07-01 | 0.79642 | +0.1 | Changed display |
| 2008-07-02 | 0.79642 | +0.1 | Repeated display |
| 2008-07-03 | 0.79642 | +0.1 | Repeated display |
| 2008-07-04 | 0.84339 | +0.2323 | Changed display |
| 2008-07-05 | 0.860055 | +0.016665 | Changed display |
| 2008-07-06 | 0.860055 | +0.016665 | Repeated display |
| 2008-07-08 | 0.860055 | +0.016665 | Repeated display |
| 2008-09-21 | -0.55306 | +0.17593 | Changed display |
| 2008-10-25 | -3.36287 | -0.2472 | Changed display |
| 2008-12-29 | -1.88519 | -0.30626 | Changed display |
| 2009-01-25 | -1.72447 | -0.07272 | Changed display |
| 2009-03-27 | -2.49069 | +0.03693 | Changed display |
| 2009-07-22 | -0.88804 | +0.01759 | Changed display |
| 2009-08-03 | -0.79945 | +0.04872 | Changed display |
| 2009-08-23 | -0.82400 | -0.00888 | Changed display |
| 2009-09-24 | 0.864280 | +0.127141 | Changed display |
| 2009-12-27 | 0.756325 | -0.01957 | Changed display |
| 2010-07-20 | 0.370741 | +0.004869 | Changed display |
| 2010-08-21 | 0.370741 | +0.004869 | Repeated display |
Download and cite the collection
Each row includes the capture timestamp, the displayed close, the change printed on that page, and its source URL. The underlying close date is unknown. The displayed change must not be interpreted as the difference between consecutive rows in this collection.
Suggested citation: ratethegod editorial team (2026), GodIndex recovered homepage observations, version 2026-09-06, followed by this page’s URL, your access date and the relevant original capture. The downloads contain aggregate displays only, not individual votes.
Have an old export, a dated screenshot or the missing calculation code? Help us complete the archive. Please describe the material before sending files containing personal information.
Sources & verification
- Original launch-period report
- Financial-crisis commentary, 19 September 2008
- Technical analysis, 23 July 2009
- First capture in the collection
- Last capture in the collection
Editorial review: 6 September 2026. Found an error or another archive? Please contact us.